
Built for you, or built by you.
Most brands and agencies burn hours daily stitching data together across tools, tabs, and exports. Use ECOMMANALYTICS.COM instead.
- —Choose Managed: custom data setup, 100+ dashboards, built and maintained by our team
- —Choose Serve: connect your own BigQuery or Google Sheets, embed existing dashboards, or build exactly what you need from scratch
- —White-label the entire platform and present it as your own software
Managed by us, or self-serve by you. Pick what fits.
One platform. You choose how it runs.
Both run on the same powerful platform. The difference is who builds and runs it.
You do it yourself.
Connect your own data, build your own pages and widgets, and invite your team. Optional white-label so you can rebrand and resell.
- Connect your own BigQuery or Google Sheets
- Build your own pages & widgets
- Invite your whole team
- White-label & resell (add-on)
Best for in-house teams and agencies that want to build and brand their own analytics.
Start free trialWe do it all for you.
Our team builds your data setup, your dashboards, your formulas and your AI analyst — and keeps it all running.
- Built for your brand from scratch
- 100+ custom dashboards for your team
- Drag-and-drop dashboard builder
- Eric AI analyst, trained on your data
- Maintained and managed by our team
Best for DTC brands that want a data team without hiring one.
Book a demoWhat's in each, side by side.
A quick look at what comes with Serve and what comes with Managed.
| Feature | Serve | Managed |
|---|---|---|
| Setup | ||
| Done-for-you setup by our team | ||
| Dedicated account manager | ||
| Data connections | ||
| Connect your own BigQuery | ||
| Connect your own Google Sheets | ||
| 650+ managed connectors | ||
| Dashboards & building | ||
| 100+ pre-built BI dashboards | ||
| Drag-and-drop dashboard builder | ||
| Build your own pages & widgets | ||
| Embed Looker Studio or Power BI Dashboards | ||
| Custom work | ||
| Custom formulas & metrics | ||
| Custom-built data model (fulfilment, fees, refunds, FX and more) | ||
| Free customisation hours every month | ||
| AI & integrations | ||
| Eric AI analyst | ||
| MCP server (Claude / LLM access) | ||
| Apps | ||
| Desktop App | ||
| Mobile App | ||
| Branding | ||
| White-label + custom domain | Add-on | |
| Custom email sender | Add-on | |
| Billing | ||
| Billing | Per seat + workspace | Per store, custom |
- Setup
- Done-for-you setup by our teamServeManaged
- Dedicated account managerServeManaged
- Data connections
- Connect your own BigQueryServeManaged
- Connect your own Google SheetsServeManaged
- 650+ managed connectorsServeManaged
- Dashboards & building
- 100+ pre-built BI dashboardsServeManaged
- Drag-and-drop dashboard builderServeManaged
- Build your own pages & widgetsServeManaged
- Embed Looker Studio or Power BI DashboardsServeManaged
- Custom work
- Custom formulas & metricsServeManaged
- Custom-built data model (fulfilment, fees, refunds, FX and more)ServeManaged
- Free customisation hours every monthServeManaged
- AI & integrations
- Eric AI analystServeManaged
- MCP server (Claude / LLM access)ServeManaged
- Apps
- Desktop AppServeManaged
- Mobile AppServeManaged
- Branding
- White-label + custom domainServeAdd-onManaged
- Custom email senderServeAdd-onManaged
- Billing
- BillingServePer seat + workspaceManagedPer store, custom
Get data from every tool your brand runs on. All in one place.
650+ managed connectors on Managed, plus BigQuery and Google Sheets on Serve. If you use it, we can read from it.
Eight modules. One platform. Built for your brand.
Inside one powerful app.
Every channel, every metric, every store — in one place. ROAS, CPA, contribution margin, spend, email, creative performance and more. All normalised to your reporting currency.
- 650+ available sources
- Multi-currency · multi-store
- All accessible in our app
Built from scratch. For your brand.
No generic metrics. We write the code behind every number — fulfilment costs, payment fees, contribution margin, refunds, subscriptions and more. Engineered for your stack, not bolted onto a template.
- Custom build for your store
- Your formulas, not ours
- Maintained by our team
100+ dashboards. Ready in 48 hours.
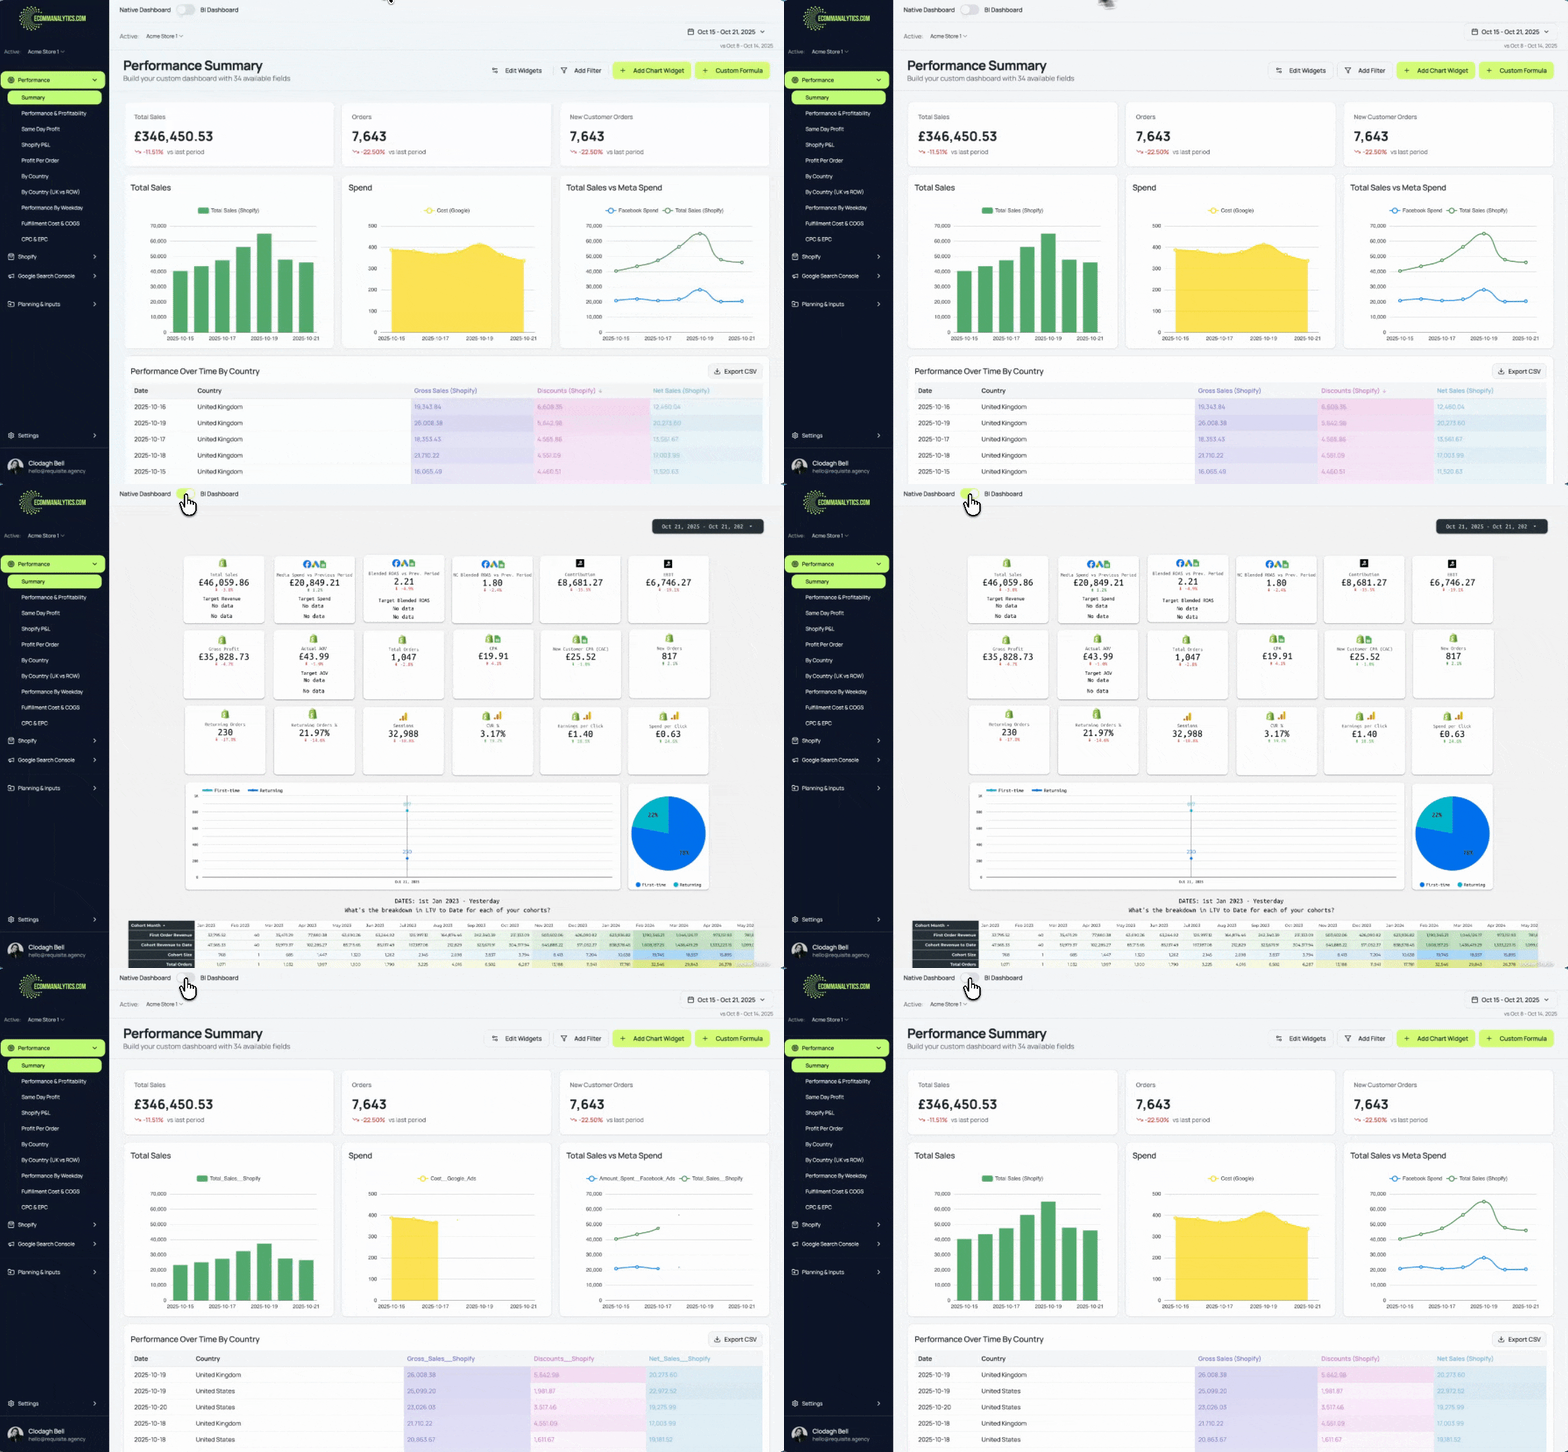
Your whole team gets instant access to 100+ BI dashboards covering every corner of your business — channel performance, retention, contribution margin, LTV, forecasting and ops.
- Access in days, not months
- Team-wide access
- Customised for your brand
Your dashboards. Your way.
Every user gets drag-and-drop builders to create their own personal views — charts, scorecards, pivot tables and custom metrics. Save them, share them, or keep them personal. No code.
- Widget-based drag-and-drop
- Custom metrics and formulas
- Save and share across your team
Built-in tools for better decisions.
Marketing planners, CPA and ROAS calculators, LTV models and custom ops tools — all built directly into your workspace. Request a tool, we can build it in.
- Retention forecasting
- CPA / ROAS calculator
- LTV models
- Request anything
Request it. We build it.
Customisation hours are included in every plan. Submit a request and our team builds it, ships it and maintains it — tracked transparently so you always know where things stand.
- Customisation hours in every plan
- Built, shipped and maintained by us
- Every request tracked
Your custom data & AI.
Eric is your in-app AI analyst, trained on your brand from day one — your metrics, your definitions, your history. Plus, connect Claude directly to your ECOMMANALYTICS data via MCP and ask from anywhere.
- Trained through your 'Brand Brain'
- Plain English answers, no complex code
- Claude MCP integration included
See how you stack up.
Anonymised performance comparisons across your peer set — see whether your ROAS, CPA and spend efficiency are strong or just average for your countries. Currently Meta and Google Ads, more coming soon.
- Anonymous peer benchmarking
- Meta and Google Ads currently
- More channels coming soon
Built with operators, for operators.
"I use the native dashboards for my own analysis but everyone in the team gets the BI dashboards. We're all reporting from the same location. It's transformed the business."
"Their knowledge of ecommerce is extensive. You can see it in the reports. In one click I can access my entire store's performance and the data is so easy for me and my team to digest."
"The team custom-builds every table for every page, per client. No one-size-fits-all. The fields we need, with the formulas that fit our business."
See it with real data.
Book a 30-minute demo.
Founder-led. We'll walk you through the set up we'd build for your brand.
Not sure what plan? Don't worry. We'll show you both and help you pick.